
Welcome to the CIRCA help page. Here you will find all the information you need for a successful search.
There are three modes of querying CircaDB: By gene symbol, Simple and Advanced. In all three modes using the wildcard character "*" is possible.
This is the default. Simply enter a set of terms and the engine will query for
each term separately, then join all of the results from each separate term together
into the final result. In other words a query for kinase inhibitor
will return all entries with the word kinase together with any entry
that has inhibitor in their respective annotations.
This is usually not what one would want returned from such a query. This is where the advanced query mode comes in.
Once the "advanced query mode" check-box has been selected, the query strings are no longer simply split into individual queries. As the saying goes "with great power comes great responsibility". In a nutshell, you must now use the underlying Sphinx search engine's extended syntax query mode.
Briefly, the default behavior of the query kinase inhibitor would bring
back all entries that match both kinase AND inhibitor.
Instead of an implicit OR between terms, there is now an implicit
AND between terms.
To bring back the OR behavior you would need to separate terms
with a | (a vertical bar, or "pipe") character. E.g.
kinase | inhibitor.
To bring back the specific phrase "kinase inhibitor", you would need to
surround both words with quotes. E.g. "kinase inhibitor"
Query for the exact phrase "kinase inhibitor" that also make mention of "mitochondrial"
"kinase inhibitor" mitochondrial
Query for kinases, but not any entry with "inhibitor" in the record
kinase !inhibitor
Sphinx is a large a powerful system. You can review all of the various ways to use the extended syntax at the Sphinx extended query syntax help page
Having read the above, you may be wondering what fields you can use to query CircaDB. The annotation is straight from the Affymetrix annotation files. We have pulled out certain columns from that file and indexed them as follows:
| Field | Description |
|---|---|
| probeset_name | The Affymetrix probeset name |
| transcript_id | The transcript ID |
| representative_public_id | |
| unigene_id | Unigene ID |
| gene_symbol | NCBI gene symbol |
| gene_title | Full gene title |
| entrez_gene | The Entrez gene ID |
| swissprot | The SwisProt accession |
| refseq_protein_id | The RefSeq protein accession |
| refseq_transcript_id | The RefSeq NA sequence accession |
| target_description | The description from the Affymetrix annotation file |
The probability filter can be used to narrow the output to the most significant results. The database can be filtered for p-values and q-values produced by the different algorithms. The given value is used as the upper cutoff.
We have applied CYCLOPS (Anafi et al., PNAS 2017), an algorithm designed to reconstruct sample order in the absence of time-of-day information, to the public GTEx collection (GTEx Consortium, Nat. Genet. 2013) of 632 human donors contributing 4,292 RNA-seq samples from 13 distinct human tissue types. Additional sample information can be found at GTEx’s documentation page: https://gtexportal.org/home/documentationPage.
For each tissue that was CYCLOPS ordered, cosinor regression (modified, Anafi et al., PNAS 2017) was used to test if individual genes are rhythmic or not. We only looked for rhythms with a period of 24 hours. Gene-level expression data was filtered to exclude any gene with a read count of zero (TPM = 0) in any sample. Following this, only the top 15,000 expressed genes by median TPM were considered for each tissue.
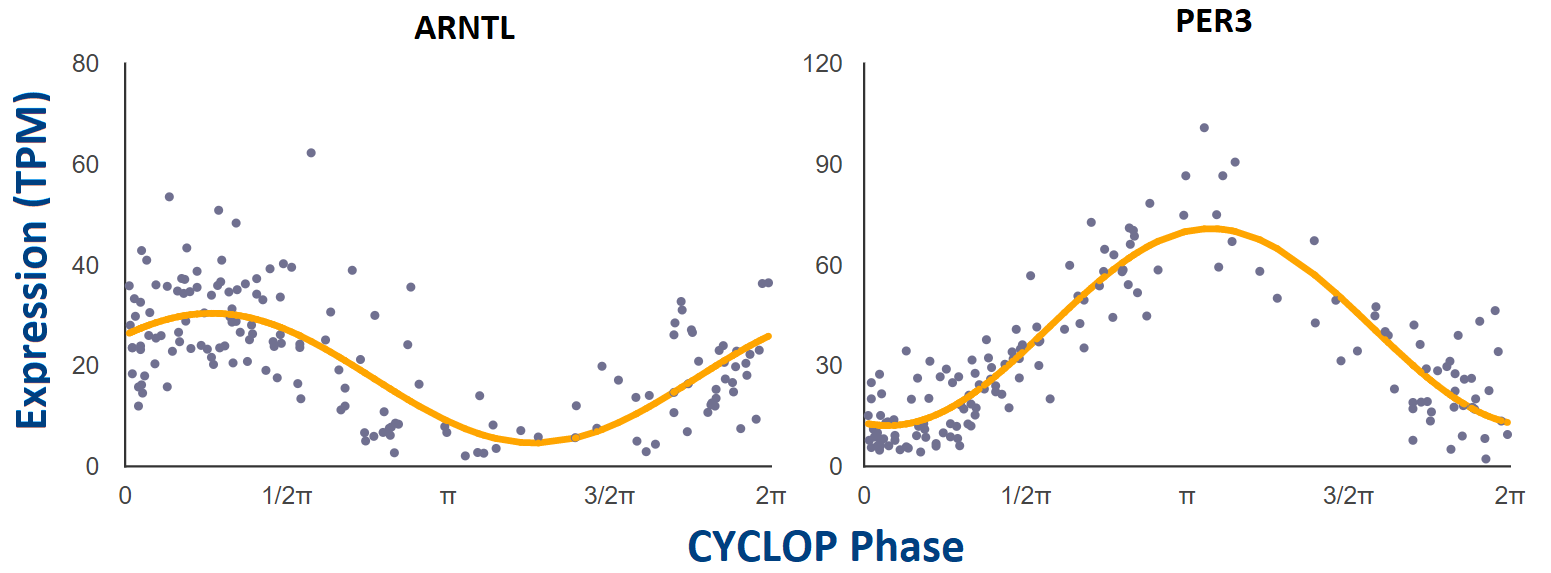
Each point represents a single human donor. The x-axis is the CYCLOPS-estimated
sample phase in radians (from 0 to 2𝝿). The y-axis is the expression level (TPM)
from RNAseq. Phase has been adjusted so that time 𝝿 represents E-box phase (i.e. time
of peak expression of E-box target genes NR1D1, NR1D2, and PER3).
The probability of seeing data at least this extreme given the null hypothesis is true – that the dataset is not rhythmic.
FDR is the ratio of false-positives to total genes discovered at a particular threshold. This is an adjustment to P-value in order to control the number of false discoveries when simultaneously testing multiple hypotheses (Benjamini & Hochberg, J. R. Stat. Soc. 1995).
Coefficient of determination from cosinor regression. This is a measure of how well the data fit to a 24 hour sine wave. A value of 1 is perfect – all of the points line up on the curve.
A measure of the magnitude of oscillation (i.e., effect size).
How often the cycle repeats. We tested only for patterns that repeat every 24 hours.
Identifies the time of peak expression.
There are three different algorithms to statistically test if a dataset is cyclic or not. More information about these algorithms can be found in the About tab.
Note: For all the algorithms we tested cyclic behavior for a range of different periods, except for the DeLichtenberg were we only looked for a period of 24 hours.
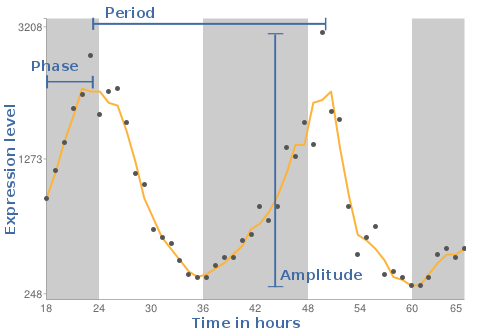
As result we will see a plot, where the X-axis is the time in hours and the Y-axis reflects the expression levels measured on the individual gene chips. The background shaded areas represent the cycle of light and dark conditions based on CT times.
This statistical size, is the estimated probability of rejecting the null hypothesis. Here the null hypothesis is a dataset not being cyclic. The lower the p-value the more significant is the test result.
The q-value of a test is the minimum false discovery rate at which a gene is mistakenly called cyclic.
This value gives information on how often the cycle is repeated. Is the period 24 , the pattern reoccurs every 24 hours.
The phase reflects the timing in the individual tissues. The DeLichtenberg algorithm does not provide this value in its output.
| How do I select more than one experiment? | "Ctrl+Right Click" lets you select multiple experiments ("Command+Right Click" for mac users) |
|---|---|
| How do I request a data set be added to CircaDB? | Researchers can request that a particular data set be added by submitting an issue at our project page hosted at Github. |